Market & Economic Summary 4Q–2024
Leading by Example: US Markets Shine Again
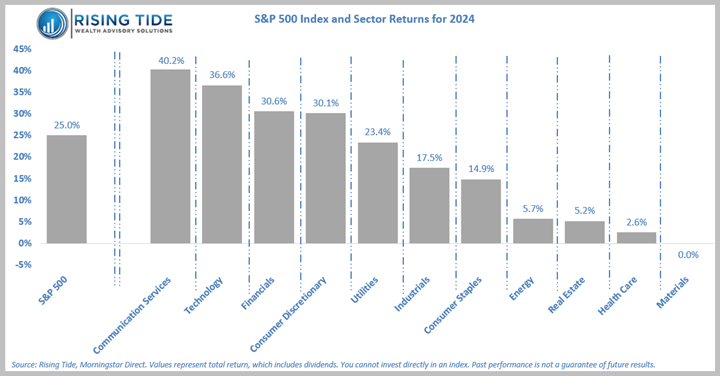
Global equity markets in 2024 reflected a year of varied outcomes. The United States remained the leader, with the S&P 500 surging by an impressive 25.0%, outpacing both developed and emerging markets. Within the US, the rally continued to be driven by growth stocks, including the “Magnificent Seven” tech giants—Microsoft, Apple, Alphabet, Amazon, Nvidia, Meta, and Tesla. Among them, Nvidia soared 171.2%, Meta rose 66.0%, and Tesla gained 62.5%, showcasing the concentrated nature of market gains.
Growth stocks more than doubled value stocks performance-wise, +33.4% vs +14.4%. Among the eleven sectors within the S&P 500, communication services and technology led gains, rising 40.2% and 36.6%, respectively, while defensive sectors like health care (+2.6%) and materials (flat) underperformed. Large-cap equities remained the preferred choice, as the S&P 500 (+25.0%) outpaced midcaps (+15.3%) and small caps (+11.5%). Despite a late-year recovery in small caps, driven by strength in industrial and consumer-oriented sectors, the overall narrative favored mega-cap leaders.
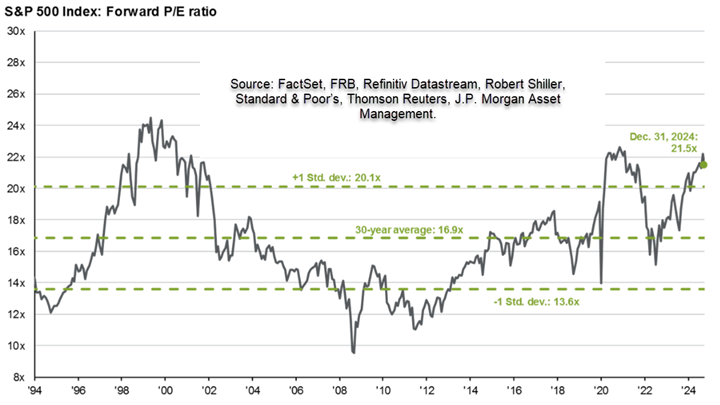
US valuations have risen significantly over the past couple of years, with the S&P 500’s price-to-earnings ratio ending the year at 21.5x (see chart below), above its 30-year average of 16.9x. This signals optimism in the US market, but it is also a function of the index’s increasing weight toward the faster-growing, more expensive tech and consumer-oriented sectors of the market. While valuation metrics serve as an important context within the market, we note that valuations are poor market timing indicators, and the market can remain “expensive” for long stretches of time. Additionally, stocks can “grow into higher multiples” when they achieve high earnings growth rates, like the Magnificent Seven.
Among foreign stocks, developed markets delivered modest gains of 4.3%, while emerging markets rose 8.1%. Developed market countries experienced notable regional divergence: Germany (+11.0%) and Japan (+8.0%) benefited from industrial recoveries and strong exports, while Switzerland (-1.0%) and France (-4.6%) lagged due to sluggish growth. Emerging markets also painted a mixed picture. Taiwan surged 35.1%, driven by robust semiconductor demand, while China advanced 19.7% on optimism surrounding government intervention to stem further fallout from the property bubble. Conversely, Brazil (-29.5%) and Korea (-23.1%) faced steep declines, weighed down by weaker exports and political instability.
In contrast to the valuations of the US, developed markets like Japan (14.1x) and Europe ex-UK (13.5x), along with emerging markets (11.9x), traded at slight discounts to their long-run averages, reflecting a combination of slower growth, regional uncertainties, and less concentration in tech stocks.
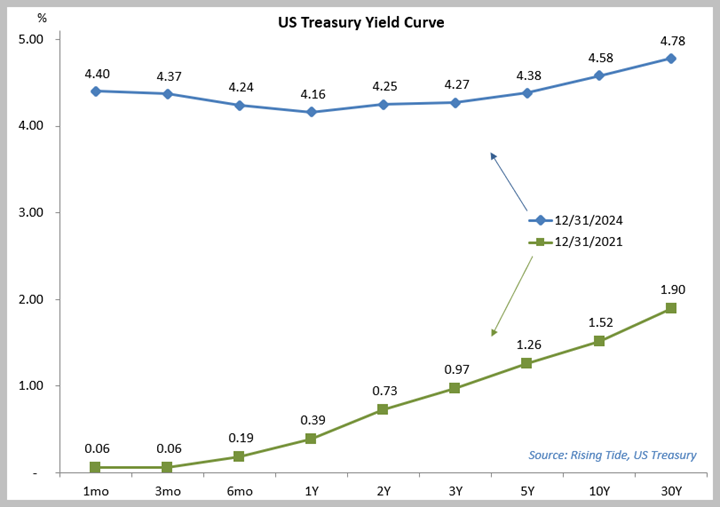
In the world of bonds, the Bloomberg US Aggregate Bond Index was +1.3% for the year, with shorter-term bonds +4.4%. While interest rates are still much higher than levels from 3 years ago (see chart below), the Federal Reserve is slowly and cautiously in the process of trying to bring rates lower to help ease the early signs of a slowing labor market, while balancing the risks of a stubborn inflation fight. The 10-year Treasury yield fluctuated throughout the year, starting at 3.9%, peaking at 4.7% in the Spring, and settling in at 4.6% at the end of the year, reflecting shifts in Federal Reserve policy, moderating inflation, and concerns of an economic slowdown. The yield curve remains only modestly inverted, signaling a cautious stance for 2025.
Among alternatives, REITs (as represented by the FTSE Nareit All Equity REITs Index) were +4.9% for the year. Among real estate sectors, specialty REITs (+35.9%), regional malls (+27.4%) and data centers (+25.2%) led gains, while infrastructure (-14.2%), timber (-16.3%), and industrial (-17.8%) REITs underperformed.
Commodities experienced uneven performance, with the Bloomberg Commodity Index finishing the year +5.4%. Precious metals shone brightly, with gold and silver both rising over 20%, driven by heightened economic uncertainty, especially in China. Cryptocurrencies also had a strong year, with the iShares Bitcoin Trust ETF climbing 59.8% in Q4 alone, fueled by increased adoption and confidence following the US presidential election results.
US Economic Highlights
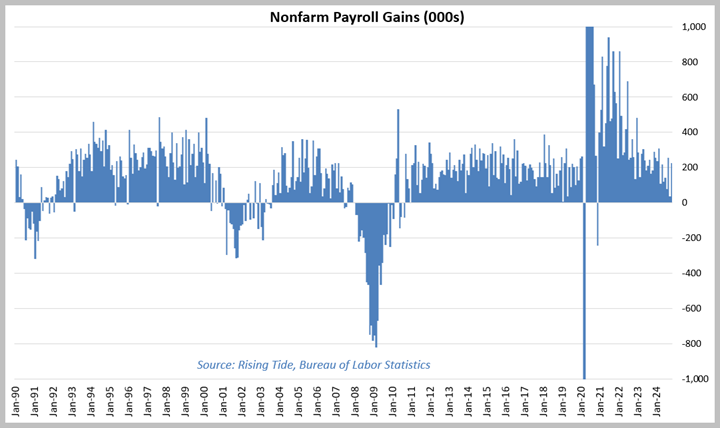
- The unemployment rate has risen steadily from its low of 3.4% in April 2023 to 4.2% by November, reflecting a gradual cooling as labor supply and demand have come more into balance. Despite this, job creation remained a bright spot, as the US labor market added more than 2 million jobs in 2024 (better than the since-1990 average of ~1.4 million), signaling underlying resilience. However, we note the rate of job gains has been on a decelerating trend since the end of the pandemic.
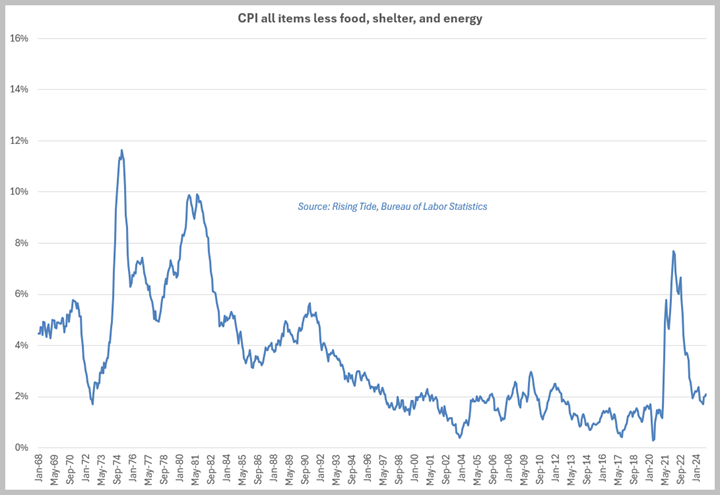
- Inflation in 2024 continued to steadily moderate, with the Consumer Price Index (CPI) for all items decelerating from 3.32% YoY in December ‘23 to 2.73% by November ‘24. Core inflation (excluding food and energy), showed a similar trend over the same timeframe, easing from 3.91% to 3.30%. Lastly, the so-called “super core” measure (excluding food, shelter, and energy) drifted from 2.21% to 2.10%, continuing to show progress toward price stability around the Federal Reserve’s 2% target.
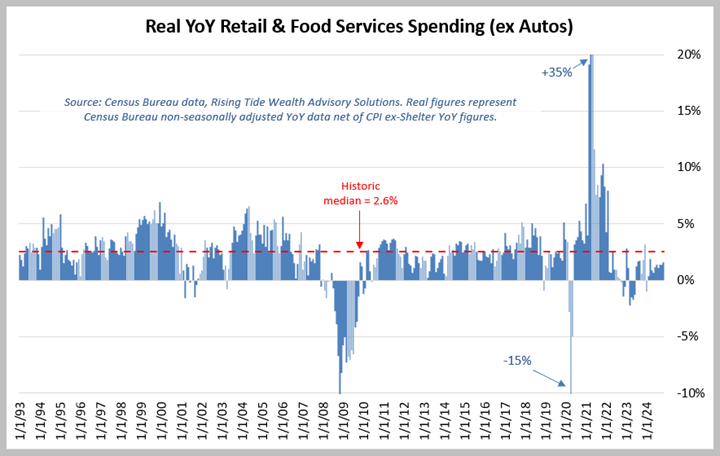
- Consumer spending in 2024 demonstrated resilience, with nominal retail and food services (excluding motor vehicles and parts dealers) growing at a steady pace, reaching a 3.2% YoY increase by November. However, inflation-adjusted spending showed a more subdued recovery, registering +1.6% YoY in November after starting the year in negative territory at -1.0% in January. This progression highlights a cautious, yet positive, consumer trajectory.
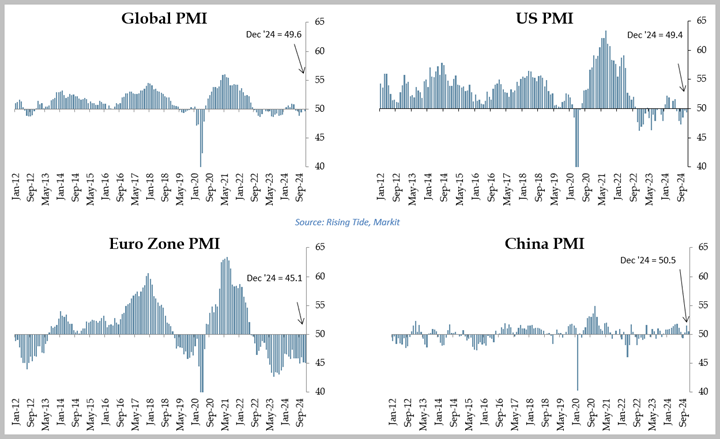
- Manufacturing activity in 2024 showed mixed results globally, with the Global PMI ending the year at 49.6, signaling contraction (readings above 50 indicate expansion, while those below 50 represent contraction). The US manufacturing sector shifted from expansion in the first half of the year to contraction in the last half, with the PMI ending at 49.7 in December. Europe contracted all year, led by Germany (43.0 avg.) and France (44.6), while Spain (52.2) stood out with solid expansion. In Asia, India maintained strong growth with PMIs consistently above 56, while China averaged 50.9. Southeast Asia saw resilience while the Middle East performed strongly.
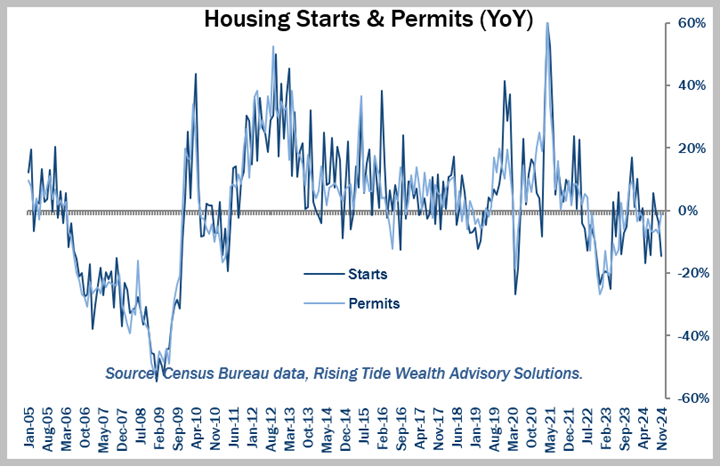
- The US housing market in 2024 experienced a slowdown in price growth, with the Case-Shiller Home Price Index YoY increase moderating from +6.2% in January to 3.6% in October. This trend reflects a cooling market, potentially influenced by affordability challenges from high mortgage rates and elevated home prices, which may be constraining buyer demand. Housing construction activity has also declined, with starts -14.6% YoY in November and permits down slightly at -1.0% YoY, signaling cautious builder activity. New home sales peaked with the 3-month moving average at 4.3% growth in September before easing to 2.5% in November.
Looking Ahead
As we enter 2025, the backdrop remains complex. US equities again led global gains in 2024, but elevated valuations and a concentrated market highlight the need for balance. Still, economic figures, while indicating softening, aren’t necessarily flashing warning signs. According to S&P Dow Jones, analysts still expect earnings growth of nearly 14% YoY in 2025 – nearly double the since-1990 average of 8.5% - while fixed income markets continue to signal uncertainty. Market performance in 2025 will likely be determined by the net effect of tailwinds like regulatory and tax reductions, offset by the headwinds of tariffs and immigration controls. Amid these dynamics, diversification and disciplined investing remain paramount.
Investors are encouraged to balance exposure across geographies, sectors, and styles, while maintaining resilience against inevitable market volatility. As history shows, preparation and perspective are vital to navigating evolving economic and market conditions. If you need help, reach out.


