Market Summary 3Q–2024
Early storm clouds give way to clearer skies.
After a strong US stock market performance over the past three quarters, particularly in large-cap technology, investor sentiment had grown cautious, sensing that the good times might soon end. With inflation on a seemingly sustainable downward trend, many felt the Fed should begin lowering interest rates to avoid pushing the “Goldilocks” economy (neither too hot nor too cold) into a downturn that could be challenging to reverse.
However, when the Fed chose to maintain high rates during its June and July meetings, a soft jobs report in early August triggered a sharp 8.5% pullback as investors feared the Fed might be falling behind. Although the market rallied in the following weeks, it slipped again in the next month with a 4.6% pullback on another set of mediocre labor data. Despite this mid-quarter volatility, the S&P 500 managed to close the third quarter up 5.9%. Analysts noted signs of a rotation, with value stocks outperforming growth stocks (9.4% vs. 3.2%) and midcap and small-cap stocks leading large caps with respective gains of 9.2% and 9.3%. However, these disparities were mainly concentrated in the quarter's first month, leveling out in the subsequent months. Among the sectors in the S&P 500, utilities and real estate were standout performers, with gains of 19.4% and 17.2%. Energy was the only sector posting a quarterly decline, at -2.3%, on the falling price of oil.
As the US dollar fell 4.3% over the quarter, international stocks outperformed US stocks, with developed markets up 7.3% and emerging markets up 8.9%. In developed markets, Germany and Switzerland led gains with returns of 10.7% and 8.6%, respectively, while Japan posted more modest growth. In emerging markets, China saw a significant boost in September with a 23.6% gain following economic stimulus measures, while South Korea underperformed, ending the quarter down 5.5%.
Falling interest rates contributed to bond market gains, with the 10-year Treasury yield declining from 4.36% to 3.81% and the Bloomberg US Aggregate Bond Index finishing up 5.2%. Longer-duration bonds outpaced shorter-term ones, with returns of 8.0% versus 3.0%, respectively. Among credit categories, corporate and emerging market bonds led gains, each returning 5.8%, outperforming Treasury and high-yield bonds.
Real estate investments, which often benefit from lower interest rates, performed exceptionally well. The NAREIT Equity REITs index gained 16.1%, driven by Office and Specialty REITs, which rose 29.5% and 26.7%, while Lodging REITs lagged at 1.5%.
Looking at the broader economy, several positive indicators remain evident. According to Standard & Poor’s, analysts project a 16.4% increase in S&P 500 operating earnings over the next twelve months, surpassing the 10.1% median since 1988, which is promising as earnings are a long-term driver of stock performance. Economic data continues to reflect a strong labor market, a steady decline in inflation, and resilient GDP growth of 3.0% annualized in Q2 2024. With the Fed easing rates and signaling potential future cuts, the economic landscape appears supportive of continued market gains.
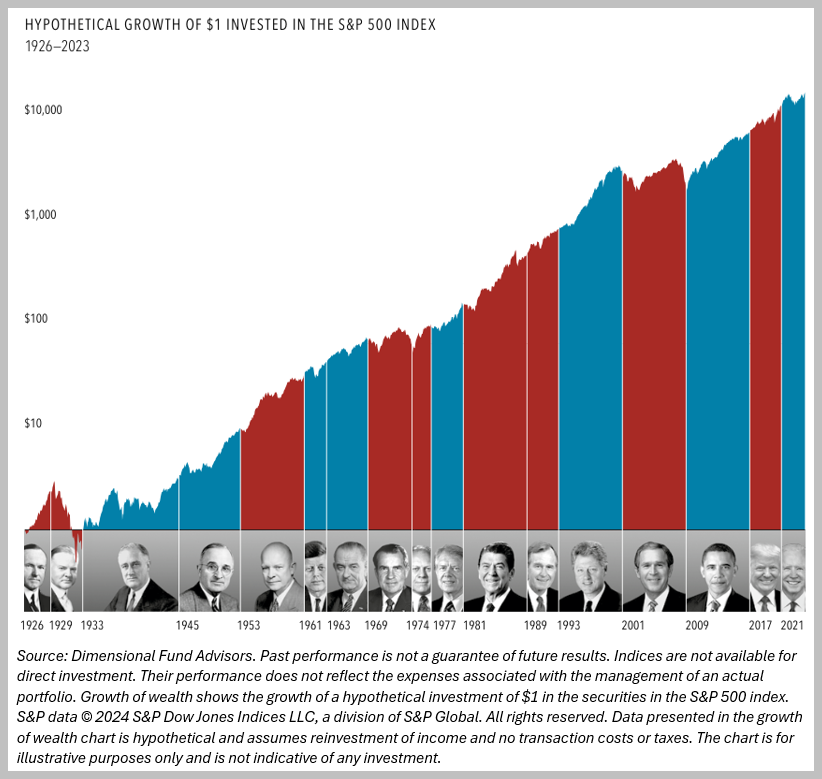
As the US election approaches, some investors may speculate about its potential market impact. However, history suggests that market performance isn’t strongly tied to election outcomes. Remember, shareholders invest in companies, not politicians, and stocks historically have shown little party preference (see chart below). Still, if the market experiences volatility, whether due to the election, geopolitical tensions, or other factors, we encourage investors to stay calm. Utilizing strategies such as tax-loss harvesting, tactical trading, and rebalancing can strengthen portfolio performance in uncertain times. Should you need assistance, Rising Tide is here to provide comprehensive portfolio assessments and support for navigating turbulent markets.